A partial clustering algorithm with automatic estimation of the number of clusters and identification of outliers
Source:R/cc_crossclustering.R
cc_crossclustering.RdThis function performs the CrossClustering algorithm. This method combines the Ward's minimum variance and Complete-linkage (default, useful for finding spherical clusters) or Single-linkage (useful for finding elongated clusters) algorithms, providing automatic estimation of a suitable number of clusters and identification of outlier elements.
Arguments
- dist
A dissimilarity structure as produced by the function
dist- k_w_min
(int) Minimum number of clusters for the Ward's minimum variance method. By default is set equal 2
- k_w_max
(int) Maximum number of clusters for the Ward's minimum variance method (see details)
- k2_max
(int) Maximum number of clusters for the Complete/Single-linkage method. It can not be equal or greater than the number of elements to cluster (see details)
- out
(lgl) If
TRUE(default) outliers must be searched (see details)- method
(chr) "complete" (default) or "single". CrossClustering combines Ward's algorithm with Complete-linkage if method is set to "complete", otherwise (if method is set to 'single') Single-linkage will be used.
- x
an object used to select a method.
- ...
further arguments passed to or from other methods.
Value
A list of objects describing characteristics of the partitioning as follows:
- Optimal_cluster
number of clusters
- cluster_list_elements
a list of clusters; each element of this lists contains the indices of the elements belonging to the cluster
- Silhouette
the average silhouette width over all the clusters
- n_total
total number of input elements
- n_clustered
number of input elements that have actually been clustered
Details
See cited document for more details.
Functions
print(crossclustering):
References
Tellaroli P, Bazzi M., Donato M., Brazzale A. R., Draghici S. (2016). Cross-Clustering: A Partial Clustering Algorithm with Automatic Estimation of the Number of Clusters. PLoS ONE 11(3): e0152333. doi:10.1371/journal.pone.0152333
#' Tellaroli P, Bazzi M., Donato M., Brazzale A. R., Draghici S. (2017). E1829: Cross-Clustering: A Partial Clustering Algorithm with Automatic Estimation of the Number of Clusters. CMStatistics 2017, London 16-18 December, Book of Abstracts (ISBN 978-9963-2227-4-2)
Examples
library(CrossClustering)
#### Example of Cross-Clustering as in reference paper
#### method = "complete"
data(toy)
### toy is transposed as we want to cluster samples (columns of the
### original matrix)
toy_dist <- t(toy) |>
dist(method = "euclidean")
### Run CrossClustering
cc_crossclustering(
toy_dist,
k_w_min = 2,
k_w_max = 5,
k2_max = 6,
out = TRUE
)
#>
#> CrossClustering with method complete.
#>
#> Parameter used:
#> - Interval for the number of cluster of Ward's algorithm: [2, 5].
#> - Interval for the number of cluster of the complete algorithm: [2, 6].
#> - Outliers are considered.
#>
#> Number of clusters found: 3.
#> Leading to an avarage silhouette width of: 0.8405.
#>
#> A total of 6 elements clustered out of 7 elements considered.
#### Simulated data as in reference paper
#### method = "complete"
set.seed(10)
sg <- c(500, 250, 700, 300, 100)
# 5 clusters
t <- matrix(0, nrow = 5, ncol = 5)
t[1, ] <- rep(6, 5)
t[2, ] <- c( 0, 5, 12, 13, 15)
t[3, ] <- c(15, 11, 9, 5, 0)
t[4, ] <- c( 6, 12, 15, 10, 5)
t[5, ] <- c(12, 17, 3, 7, 10)
t_mat <- NULL
for (i in seq_len(nrow(t))) {
t_mat <- rbind(
t_mat,
matrix(rep(t[i, ], sg[i]), nrow = sg[i], byrow = TRUE)
)
}
data_15 <- matrix(NA, nrow = 2000, ncol = 5)
data_15[1:1850, ] <- matrix(
abs(rnorm(sum(sg) * 5, sd = 1.5)),
nrow = sum(sg),
ncol = 5
) + t_mat
set.seed(100) # simulate outliers
data_15[1851:2000, ] <- matrix(
runif(n = 150 * 5, min = 0, max = max(data_15, na.rm = TRUE)),
nrow = 150,
ncol = 5
)
### Run CrossClustering
cc_crossclustering(
dist(data_15),
k_w_min = 2,
k_w_max = 19,
k2_max = 20,
out = TRUE
)
#>
#> CrossClustering with method complete.
#>
#> Parameter used:
#> - Interval for the number of cluster of Ward's algorithm: [2, 19].
#> - Interval for the number of cluster of the complete algorithm: [2, 20].
#> - Outliers are considered.
#>
#> Number of clusters found: 10.
#> Leading to an avarage silhouette width of: 0.7064.
#>
#> A total of 1925 elements clustered out of 2000 elements considered.
#### Correlation-based distance is often used in gene expression time-series
### data analysis. Here there is an example, using the "complete" method.
data(nb_data)
nb_dist <- as.dist(1 - abs(cor(t(nb_data))))
cc_crossclustering(dist = nb_dist, k_w_max = 20, k2_max = 19)
#>
#> CrossClustering with method complete.
#>
#> Parameter used:
#> - Interval for the number of cluster of Ward's algorithm: [2, 20].
#> - Interval for the number of cluster of the complete algorithm: [2, 19].
#> - Outliers are considered.
#>
#> Number of clusters found: 17.
#> Leading to an avarage silhouette width of: 0.1408.
#>
#> A total of 73 elements clustered out of 100 elements considered.
#### method = "single"
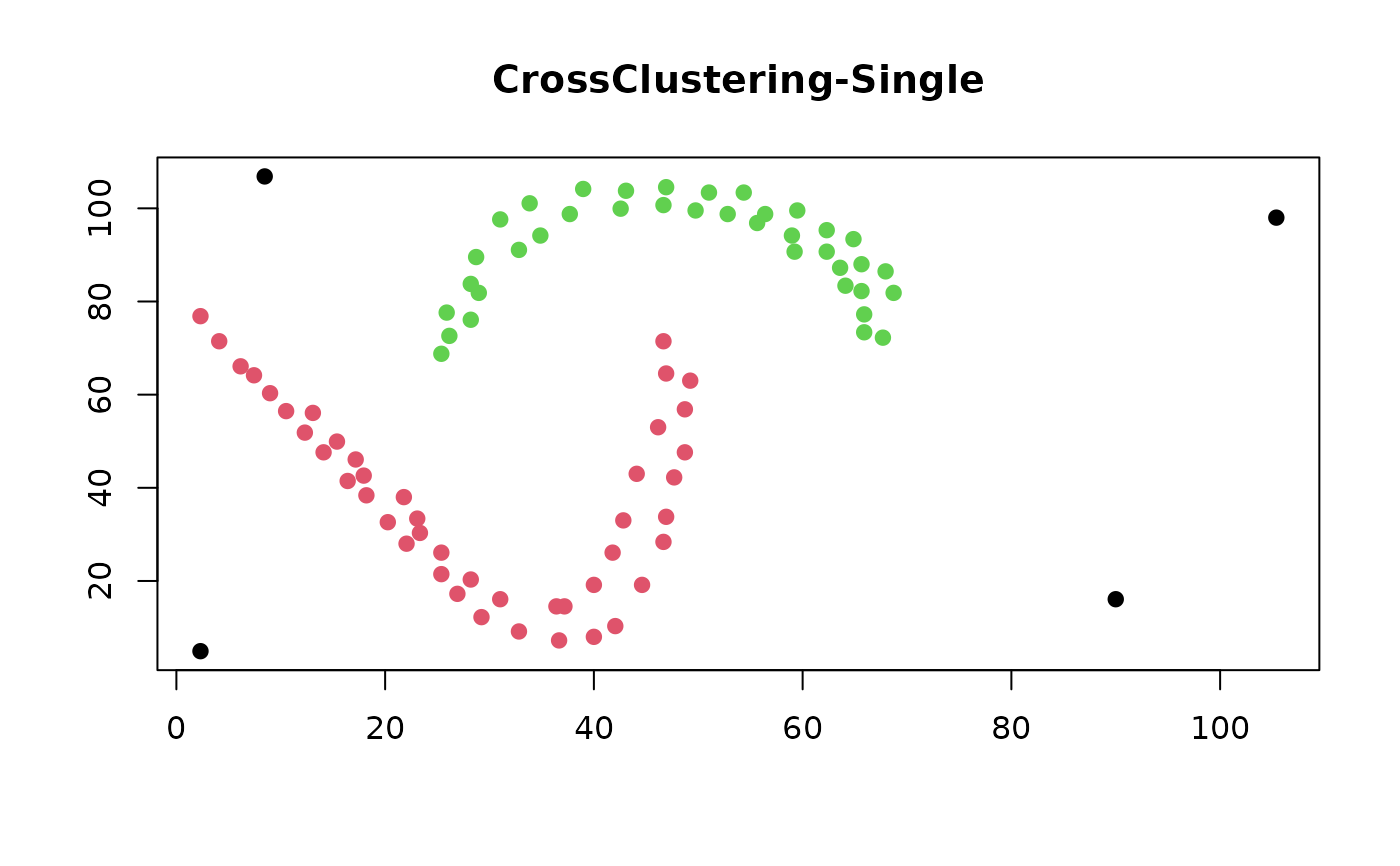
### Example on a famous shape data set
### Two moons data
data(twomoons)
moons_dist <- twomoons[, 1:2] |>
dist(method = "euclidean")
cc_moons <- cc_crossclustering(
moons_dist,
k_w_max = 9,
k2_max = 10,
method = 'single'
)
moons_col <- cc_get_cluster(cc_moons)
plot(
twomoons[, 1:2],
col = moons_col,
pch = 19,
xlab = "",
ylab = "",
main = "CrossClustering-Single"
)
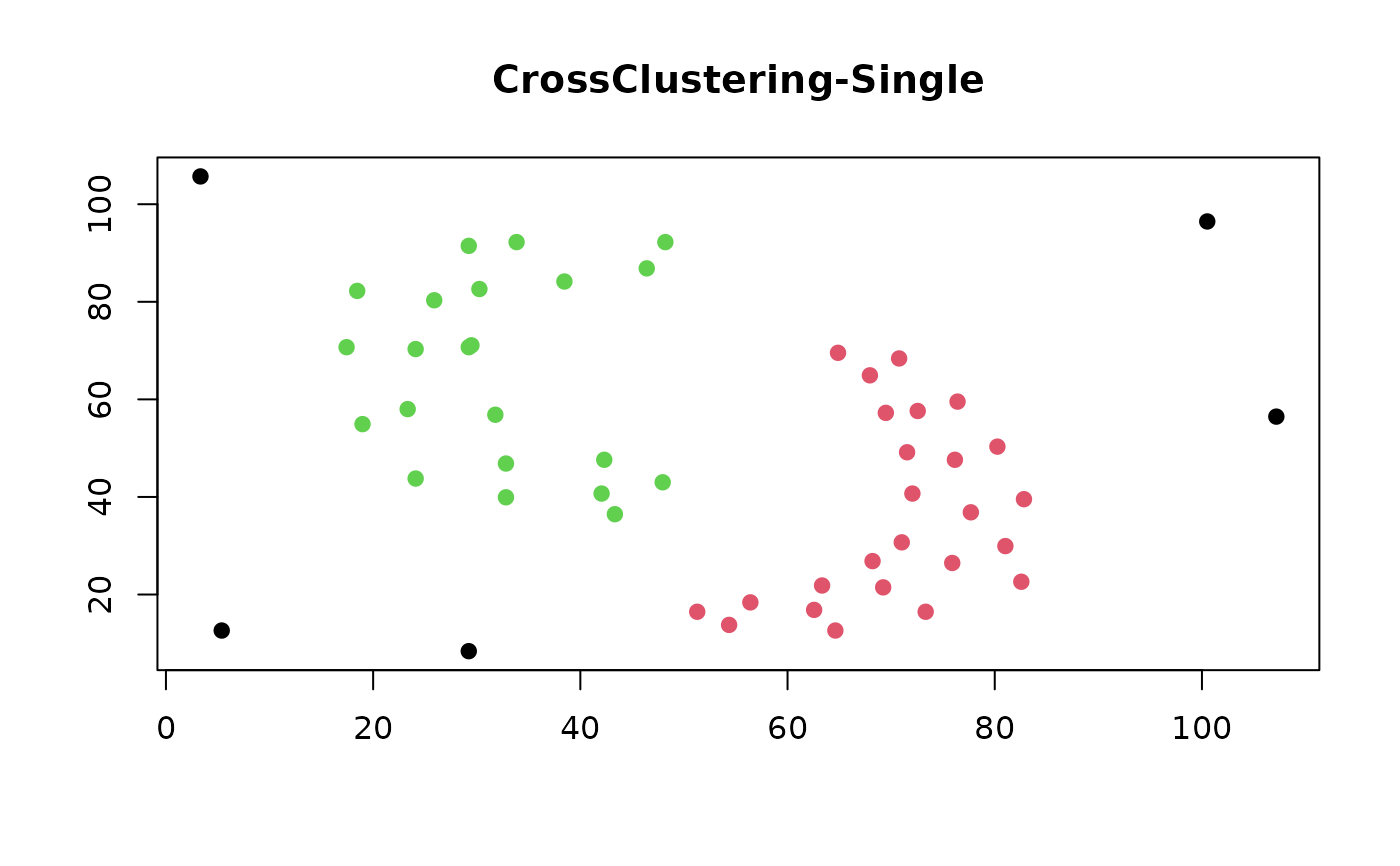 ### Worms data
data(worms)
worms_dist <- worms[, 1:2] |>
dist(method = "euclidean")
cc_worms <- cc_crossclustering(
worms_dist,
k_w_max = 9,
k2_max = 10,
method = "single"
)
worms_col <- cc_get_cluster(cc_worms)
plot(
worms[, 1:2],
col = worms_col,
pch = 19,
xlab = "",
ylab = "",
main = "CrossClustering-Single"
)
### Worms data
data(worms)
worms_dist <- worms[, 1:2] |>
dist(method = "euclidean")
cc_worms <- cc_crossclustering(
worms_dist,
k_w_max = 9,
k2_max = 10,
method = "single"
)
worms_col <- cc_get_cluster(cc_worms)
plot(
worms[, 1:2],
col = worms_col,
pch = 19,
xlab = "",
ylab = "",
main = "CrossClustering-Single"
)
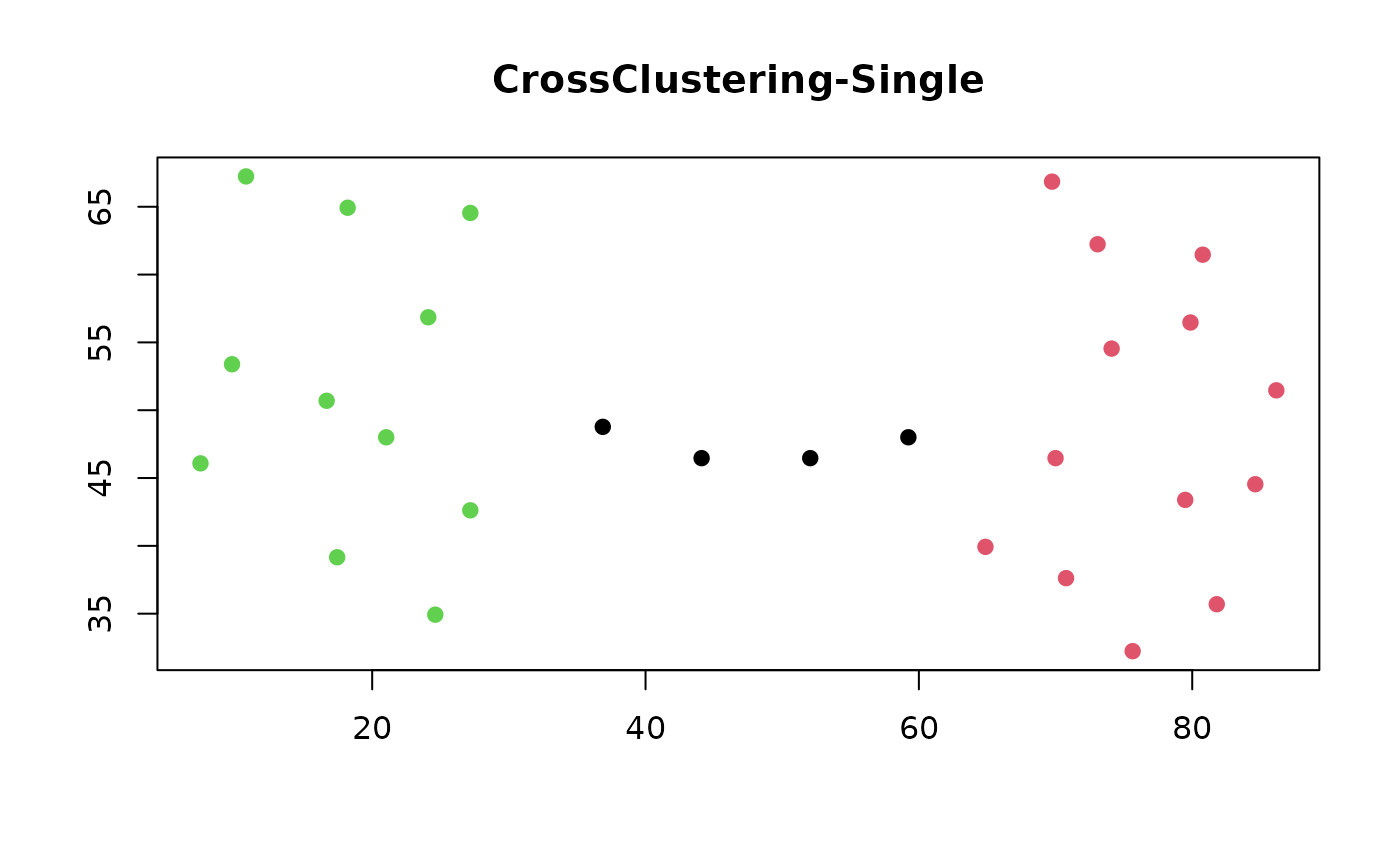
 ### CrossClustering-Single is not affected to chain-effect problem
data(chain_effect)
chain_dist <- chain_effect |>
dist(method = "euclidean")
cc_chain <- cc_crossclustering(
chain_dist,
k_w_max = 9,
k2_max = 10,
method = "single"
)
chain_col <- cc_get_cluster(cc_chain)
plot(
chain_effect,
col = chain_col,
pch = 19,
xlab = "",
ylab = "",
main = "CrossClustering-Single"
)
### CrossClustering-Single is not affected to chain-effect problem
data(chain_effect)
chain_dist <- chain_effect |>
dist(method = "euclidean")
cc_chain <- cc_crossclustering(
chain_dist,
k_w_max = 9,
k2_max = 10,
method = "single"
)
chain_col <- cc_get_cluster(cc_chain)
plot(
chain_effect,
col = chain_col,
pch = 19,
xlab = "",
ylab = "",
main = "CrossClustering-Single"
)